
Full Video
How to Boost Your Sales on Amazon: search ranking on Amazon begins with having visibility into your product’s search performance. The Search Query Performance dashboard in Seller Central provides valuable data to help analyze how your listings are performing for relevant keywords.
Specifically, there are two data points on this dashboard that provide powerful insights – total clicks and total purchases for a search term attributed to your listings. While the dashboard offers additional metrics like impressions and add-to-carts, clicks and purchases are the KPIs that can really impact your bottom line.
By extracting these two numbers for important keywords, sellers can calculate the conversion rate for those search terms. This can then be compared to the market standard conversion rate to see if your listing is underperforming. If your conversion rate is much lower than competitors, it likely explains issues with ranking and sales volume.
Identifying conversion rate problems allows you to pinpoint where SEO and PPC efforts should be focused. It helps you make data-driven decisions about optimizing listings and campaigns. In this way, the total clicks and total purchases metrics from Search Query Performance provide the insight needed of How to Boost Your Sales on Amazon.
In this article, we’ll walk through how to easily pull these valuable data points from the dashboard and use them to understand conversion performance. Let’s dive in and see how leveraging these two numbers can positively impact your Amazon business.
Step 1: Extract Total Clicks for a Keyword from Search Query Performance
The first data point we need is the total number of clicks that a particular keyword is receiving across all listings on Amazon. This provides the keyword’s overall search volume and demand.
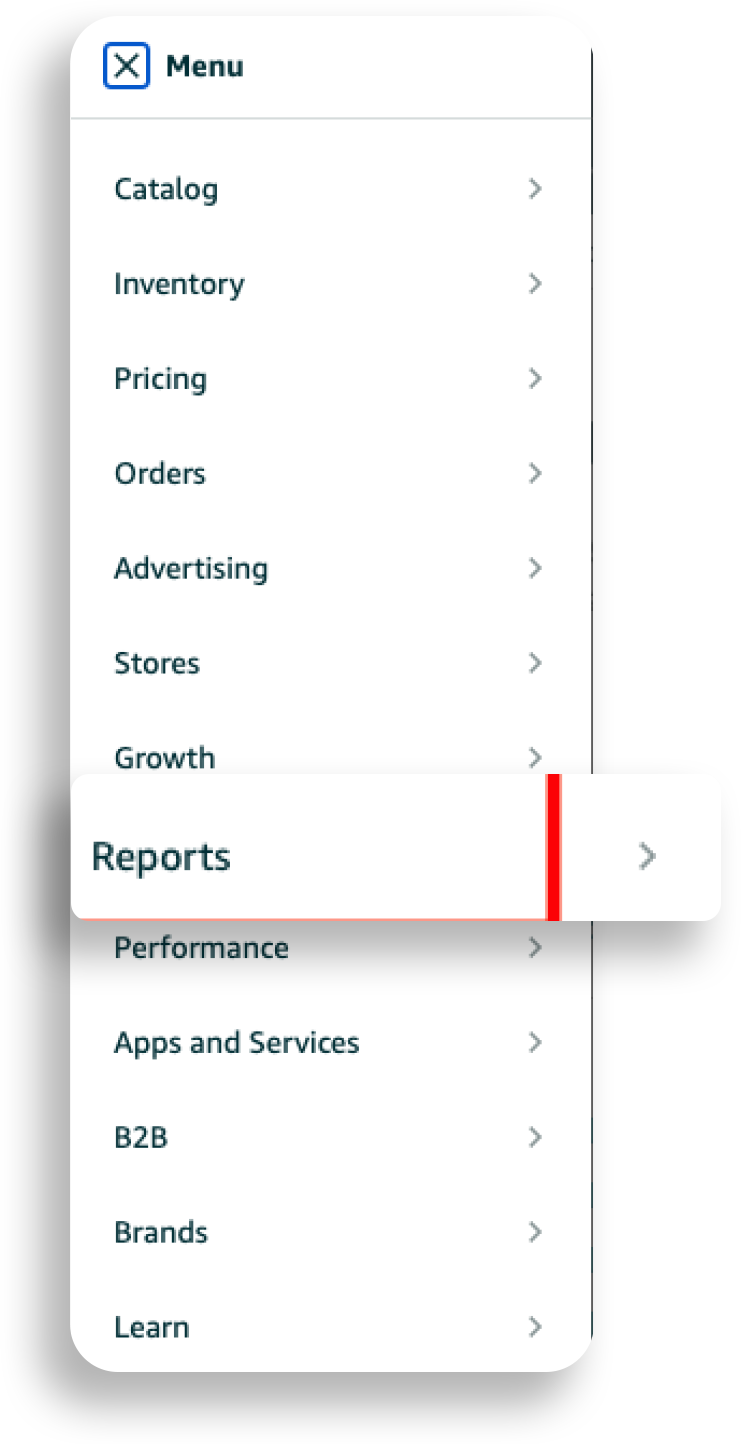
To find this, go to Seller Central and open the Search Term Report under Advertising Reports. Choose Search Query Performance. You can view data for any date range, but be sure to keep it consistent when comparing with other reports.

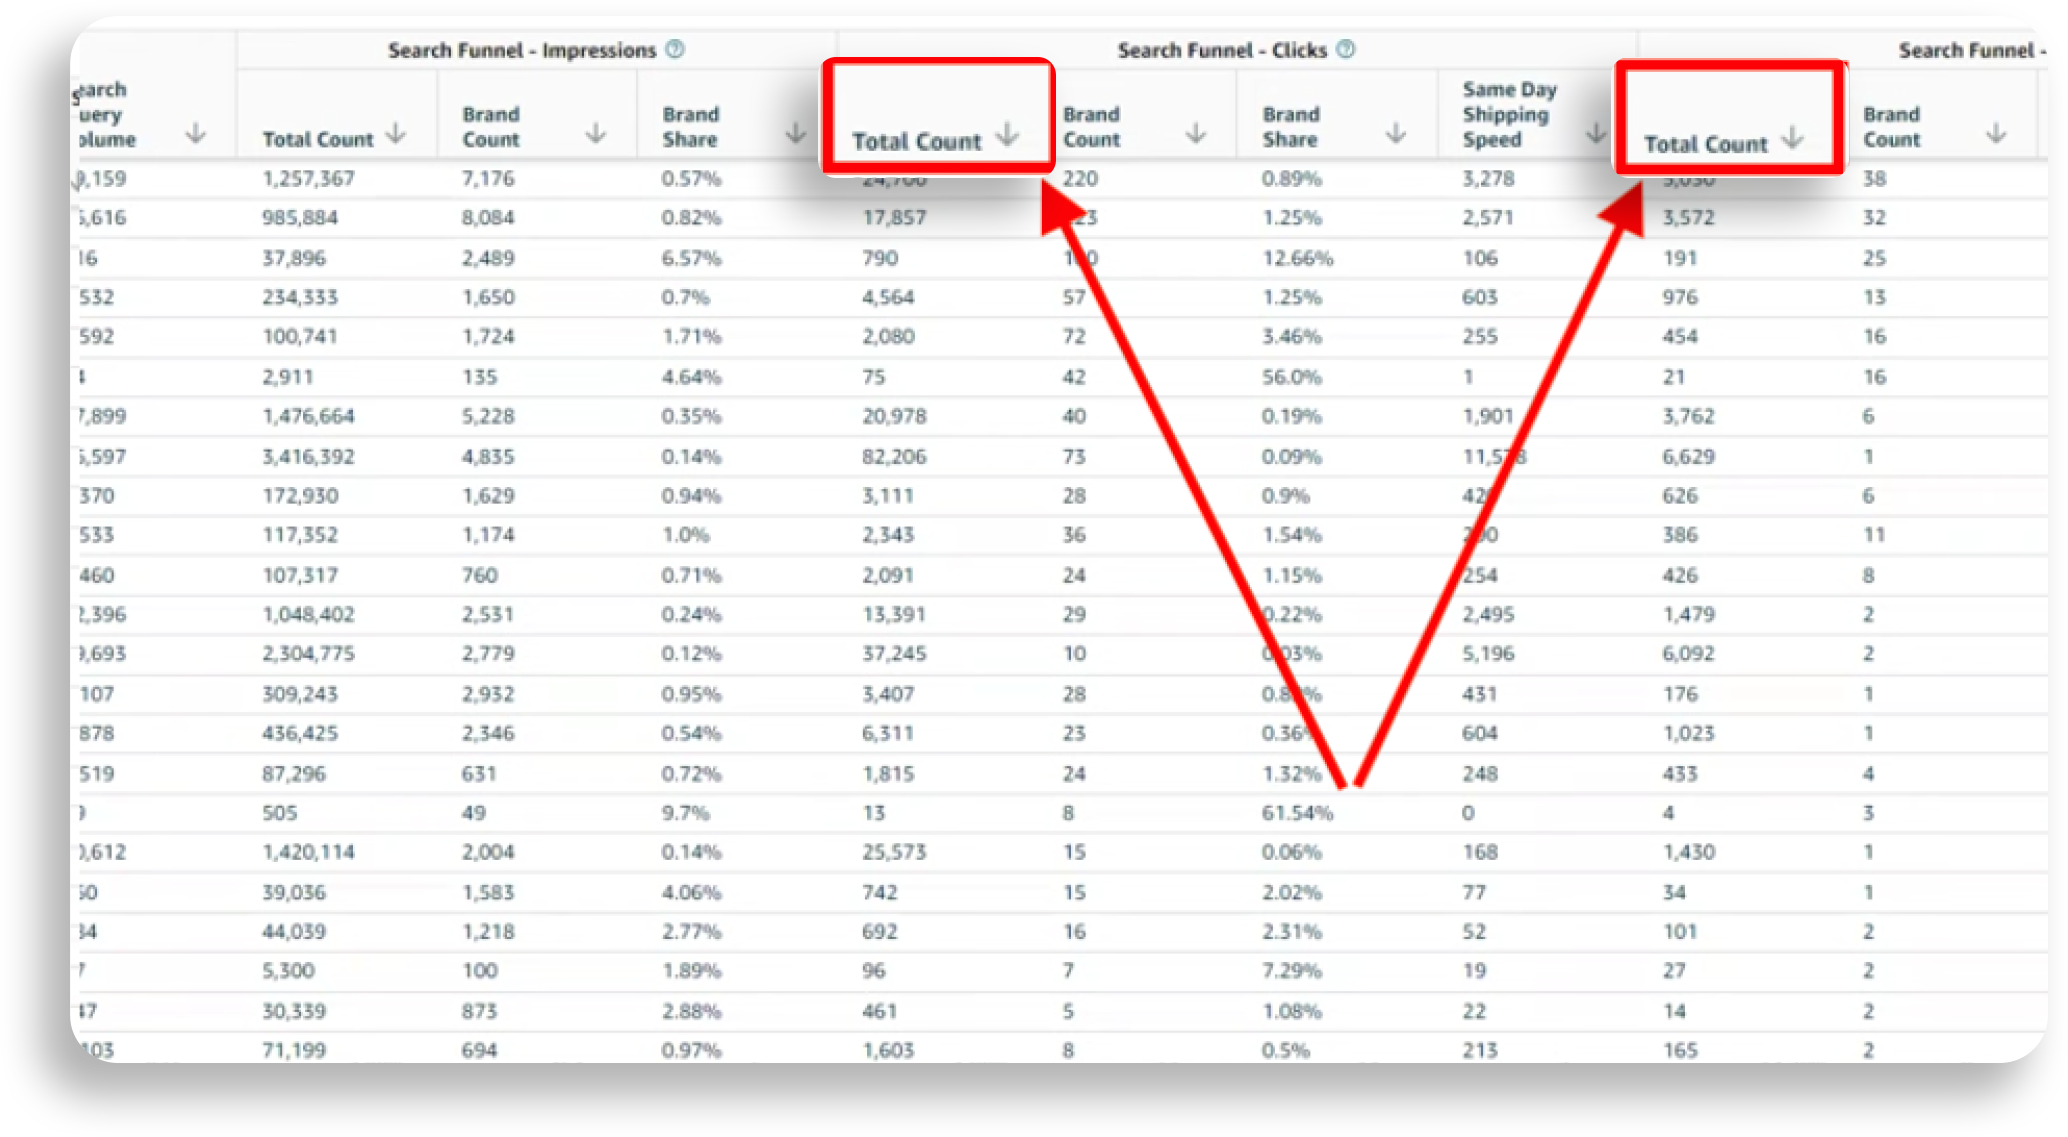
Once in the report, locate the search term you want insights for. The Total Clicks column shows the total click volume for that keyword over your selected date range.
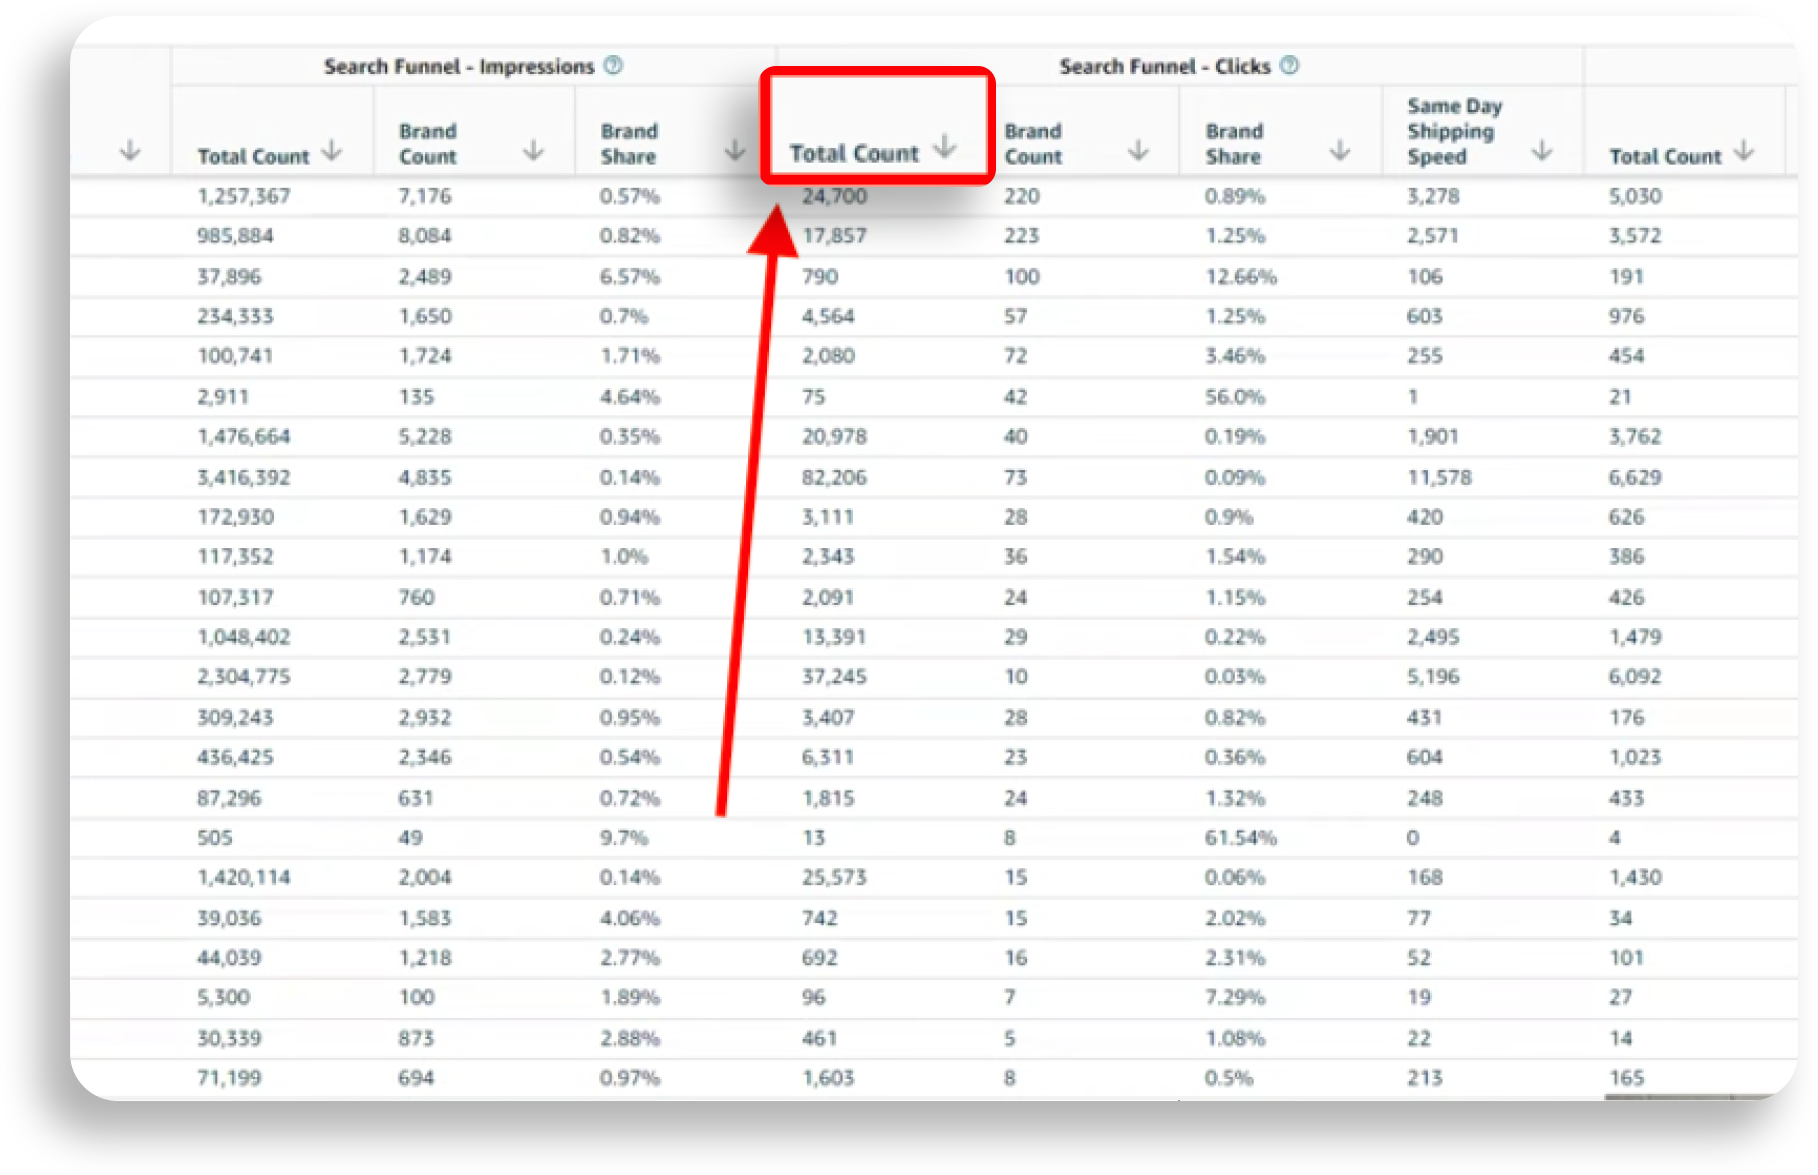
For example, if you sell phone cases and want data for “iphone 12 case”, you would find that row in the report and the Total Clicks column would display the total clicks for that search phrase.
Make sure to avoid broad terms and aim for more precise keywords with decent search volume and relevance to your listings. For instance, “phone case” would have high volume but isn’t a targeted term. “iphone 12 pro max clear case” is more specific.
You may need to download the full report CSV to find keyword variants like “iphone 12 pro max case” if they don’t appear in the preview rows. The total clicks for all variations help give the full picture.
The key is identifying keywords that are core to your product line and have sufficient search volume. Look for keywords with at least 1,000 total clicks, but the higher the better in most cases. This indicates a term that’s worth optimizing for.
Now you have the first essential data point – the total number of clicks for a high-value search term that drives traffic to competing listings. We’ll use this to calculate conversion rate next. Be sure to note down the Total Clicks numbers for reference.
Step 2: Find Total Purchases for the Keyword in Search Query Performance
After getting the total clicks, we also need the total purchases driven by that keyword across all Amazon listings. This shows how many sales the search term is generating.
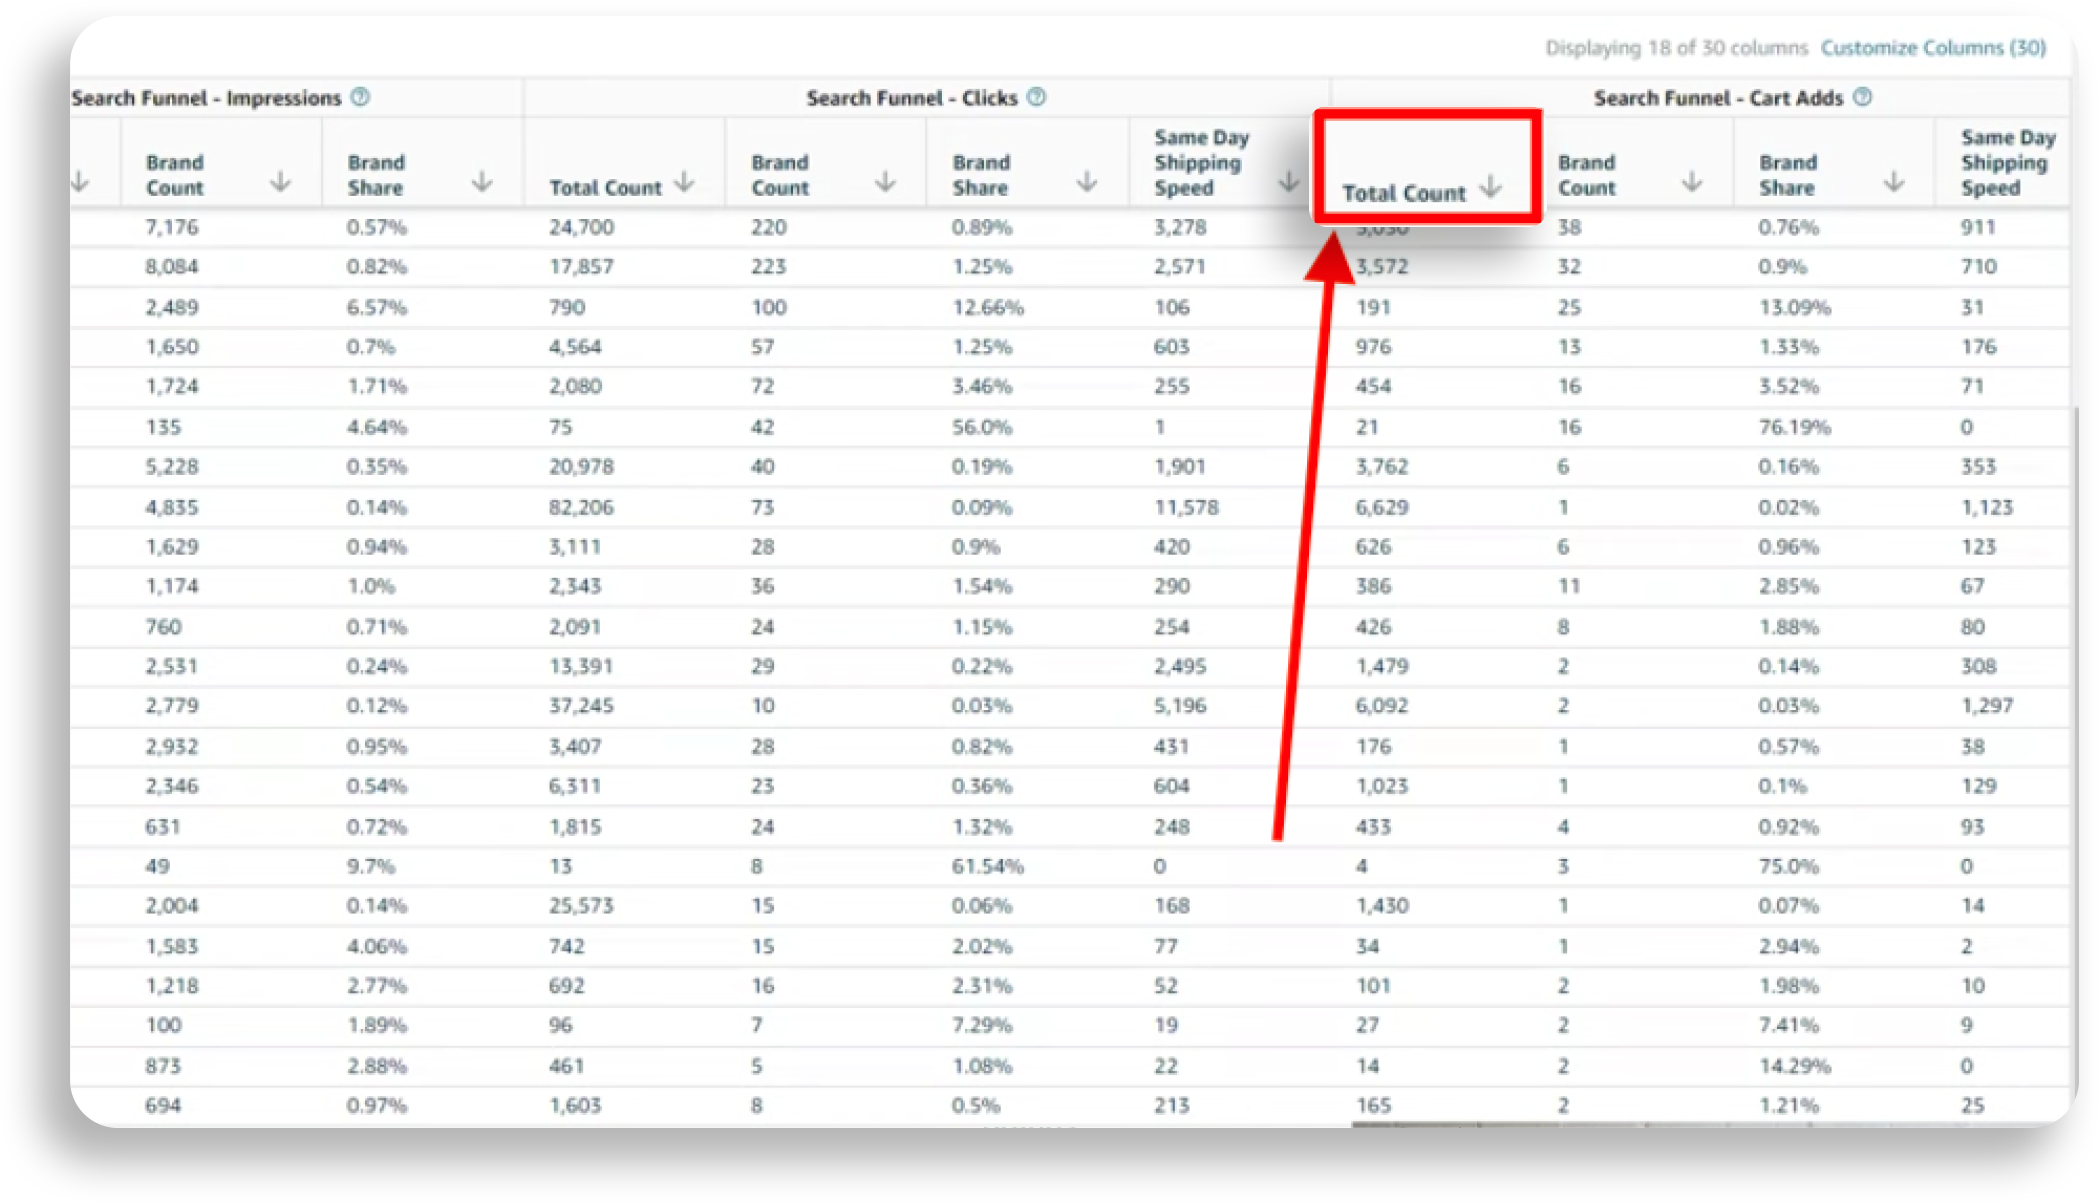
In the same Search Query Performance report, locate your chosen keyword again. Now look in the ‘Total Units Ordered’ column next to it. This shows the total number of purchases attributed to that search term over your selected date range.
For example, if your keyword is “iphone 12 pro case”, the ‘Total Units Ordered’ column would display the total purchases from all listings ranking for that keyword.
If you’re selling a product with variations like different colors or sizes, the purchase total reflects combined sales for all variations. Only ASIN-level data would show sales for each individual listing.
Try to choose keywords driving at least 100-200 purchases in a month. Anything lower may not represent significant enough search demand volume for focus. The higher the volume the better.
Note down this ‘Total Units Ordered’ number to use along with the Total Clicks we found earlier. Comparing the two metrics will allow us to calculate conversion rate.
A few things to keep in mind – the purchase total only includes sales within 24 hours of a click event. So it won’t reflect purchases made after longer consideration. Also, it is based on sales attribution, so may not match exact order numbers.
However, it still provides an insightful indicator of true search-driven conversion. Having both total clicks and purchases allows us to gauge how effectively search traffic converts to sales.
Step 3: Calculate Conversion Rate Using Clicks and Purchases
Now that we have gathered the total clicks and total purchases data points for our keyword, we can calculate the conversion rate. This metric indicates how often searches for that term result in a sale.
To find the conversion rate, simply divide the total purchases by the total clicks.
For example:
Total clicks for “iphone 12 pro case”: 5,000
Total purchases for “iphone 12 pro case”: 500
Conversion rate = Total purchases / Total clicks
= 500 / 5,000
= 10%
So for this particular keyword, the conversion rate is 10%, meaning 10% of searches result in a purchase.
The higher the conversion rate, the better, as it signals searches are converting to sales more frequently. A low conversion rate indicates opportunity to improve.
Some categories like jewelry may have conversion rates around 2-3% as purchases require more consideration. Others like consumables see higher rates near 15-20% as repeat purchases are common.
Do the calculation for several of your top keywords to see how conversion rates compare. If some seem significantly lower than others, it points to potential listing or keyword issues.
You can also calculate conversion rate for your own sponsored and organic listings separately using Brand Analytics data. Comparing your conversion rate to the overall market rate we found here provides more insights.
For example, if your conversion rate is 5% but the market rate is 15%, it suggests your listing has room to optimize to match the performance of top rankings competitors.
Step 4: Discover Market Standard Conversion Rate with Brand Analytics
How to Boost Your Sales on Amazon with Calculated the conversion rate for a keyword across all Amazon listings. Now we need to find the conversion rate specifically for the top-ranking listings in search results. This gives us the market standard conversion rate to compare against.
To find this, go to Brand Analytics and look at the product category or search term of interest. Locate the best-performing or leading listing for that keyword.
For example, if searching “iphone 12 pro case”, find the top-ranked listing from a major brand like Spigen or Otterbox. This is likely the market leader.
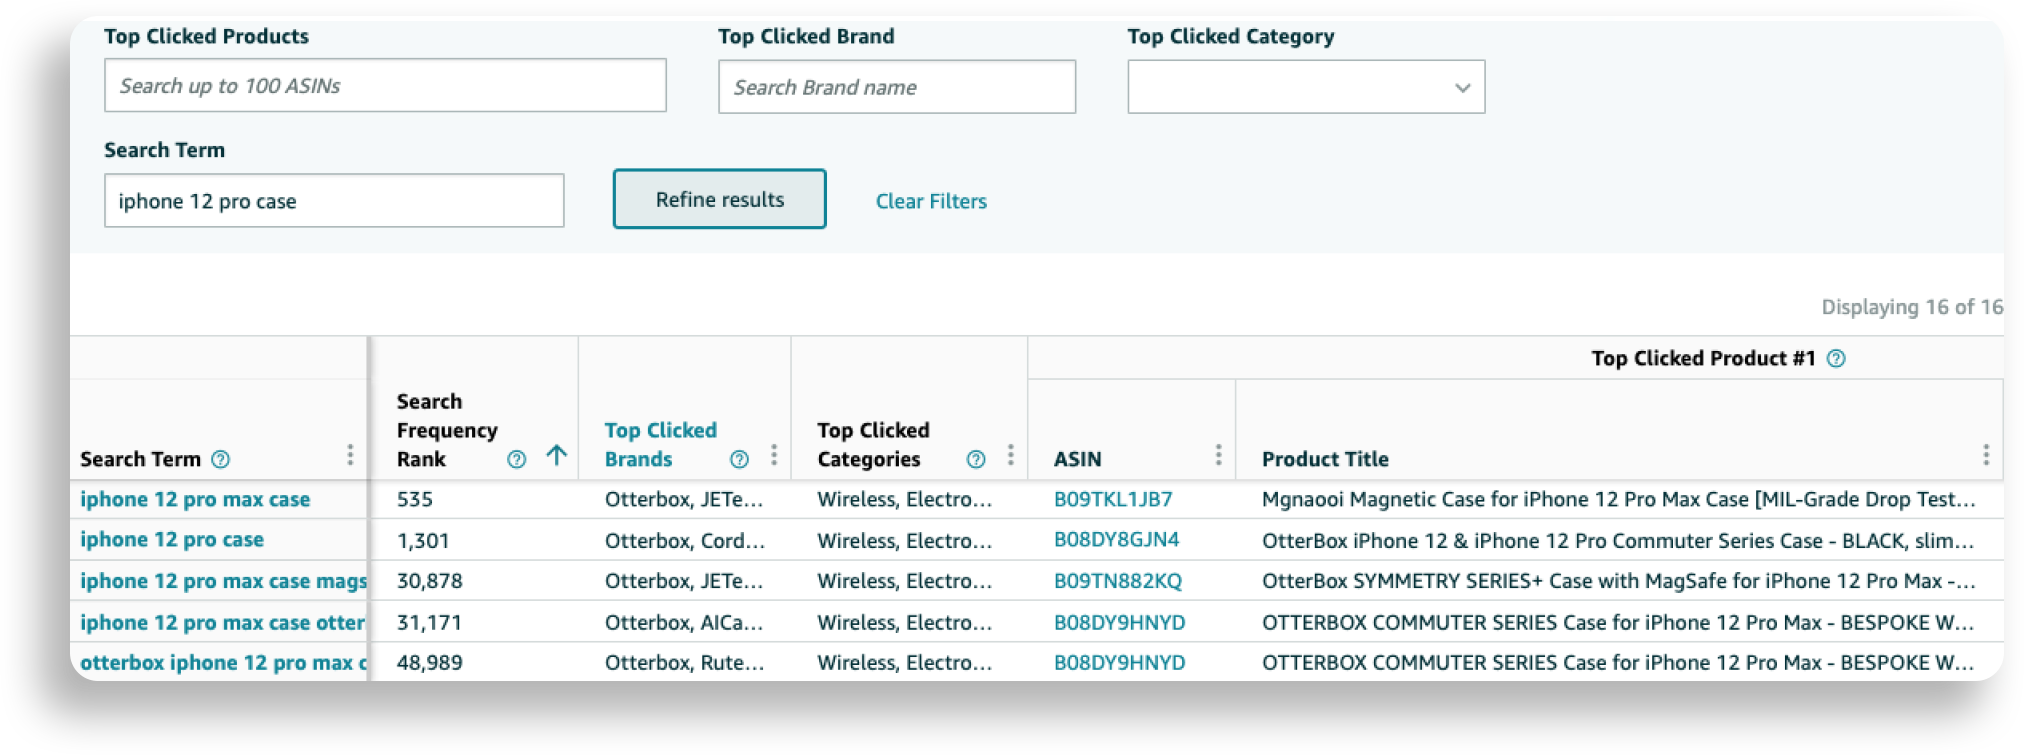
In Brand Analytics, view the ‘Click Share’ and ‘Conversion’ metrics for this listing. Click Share shows what percentage of searches result in clicks to this listing. Conversion shows the percentage of those clicks that convert to sales.
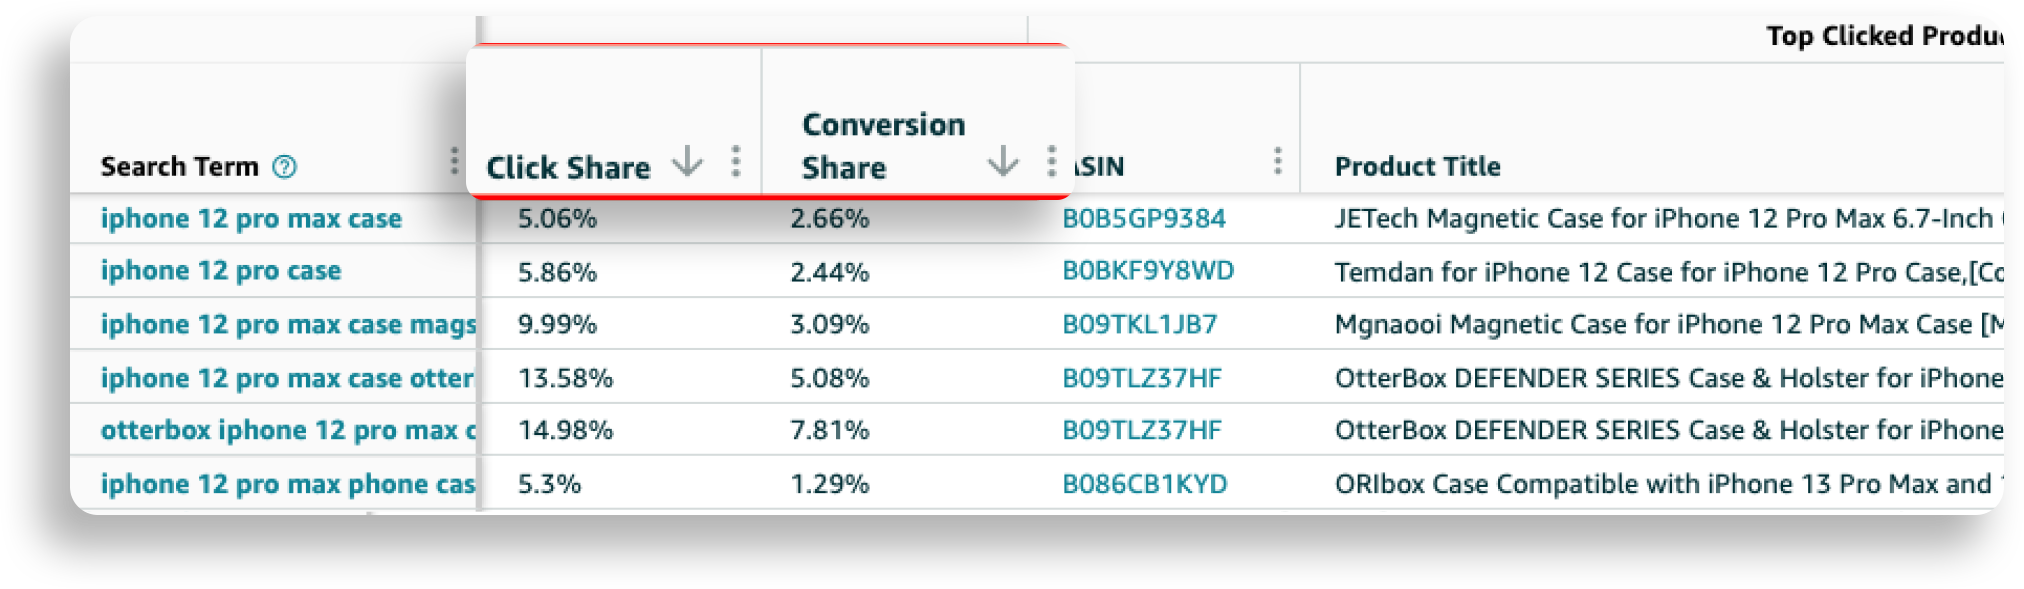
For example, if the top listing has:
10% Click Share
15% Conversion
It means 10% of searches led to clicks to this listing, and 15% of those clicks became purchases.
Multiply the Click Share and Conversion to determine the market standard conversion rate.
In this example:
10% Click Share x 15% Conversion = 1.5%
So this top listing converts searches to sales at 1.5%. This is the market standard rate you should aim to match or beat.
Compare your own listing’s conversion rate to this market leader number. If yours is lower, you have an opportunity to improve conversion through listing optimization.
Step 5: Compare Your Conversion Rate to the Market Standard
The final step is comparing your listing’s conversion rate to the market leader’s conversion rate. This reveals how you stack up against the top competition.
There are a few ways to compare:
– Look at your own Brand Analytics data. Calculate your conversion rate for a keyword using your Click Share and Conversion percentages. Compare to the market leader’s rate.
– Use the overall market conversion rate calculated in Step 3. See how your Brand Analytics conversion rate for a keyword compares.
– Find your listing’s conversion rate in Search Query Performance (divide your clicks by sales). Benchmark against the market leader.
Let’s look at an example:
– Your listing’s conversion rate for “iphone 12 case” is 2% in Brand Analytics.
– The market leader’s conversion rate is 5% according to their Brand Analytics data.
– The overall market conversion rate for “iphone 12 case” is 8% based on Search Query Performance data.
In this scenario, your 2% conversion rate lags behind both the market leader at 5% and the overall market at 8%. This significant gap indicates your listing likely has conversion issues causing it to underperform.
Optimizing your listing to increase conversion should be a priority. Improving conversion will positively impact sales and potentially search ranking.
Key areas to address could include:
– Compelling title/bullet points
– Detailed product images
– Competitive pricing
– High quality product
– Strong reviews
– Excellent product content
– Clear purchase process
– Fast shipping
Key Takeaways
Extracting and analyzing clicks and purchases data from Search Query Performance provides valuable insights into your listing’s conversion performance. Here are some of the main things to keep in mind:
– Finding total clicks shows overall search demand and traffic volume for a keyword. Aim for high-traffic keywords relevant to your products. This indicates opportunity.
– Getting total purchases reveals how much actual sales volume a keyword drives. Look for keywords generating significant sales numbers to focus on.
– Calculating conversion rate helps identify if a keyword has potential for better conversion. Divide purchases by clicks to see the rate.
– Discovering the market standard conversion rate using Brand Analytics data lets you benchmark against top performers. Strive to match or exceed this.
– Comparing your conversion rate against the market standard highlights areas for improvement. A significant gap indicates opportunity to optimize your listing and boost conversion.
– Increasing conversion for focused, high-value keywords can directly impact sales and search ranking performance. It helps maximize return from SEO and PPC efforts.
– Addressing conversion often involves optimizing title, bullets, pricing, content, images, reviews, speed, UX and more. The goal is creating an outstanding customer experience.
Regularly monitoring clicks, purchases and conversion rates provides the actionable data needed to directly increase Amazon sales. Use these metrics to make smart optimization decisions and outperform the top competition.
Wrapping Up
Boosting your Amazon product sales and search visibility starts with understanding performance for important keywords. The Search Query Performance report provides actionable data to do just that.
Specifically, leveraging the total clicks and total purchases metrics for relevant search terms can provide tremendous insight. These two data points allow you to calculate conversion rates and see how your listings compare to the market leaders.
Identifying any gaps in conversion performance is key. If your product pages fail to convert traffic as well as top competitors, it significantly hurts your sales and rankings. Diagnosing these issues is the first step to fixing them.
By optimizing your listings to match or exceed the market standard conversion rates, you can expect to see your sales and visibility climb. Improved conversion also maximizes return from advertising spend.
Regularly monitoring clicks, purchases and conversion rates should be a cornerstone of your Amazon SEO and PPC strategies. Keep a close eye on these metrics for your most important keywords, and be ready to act on any dips or disparities.
The Search Query Performance dashboard provides the level of search intelligence needed to take your Amazon product promotion to the next level. Unlock its full potential by leveraging the insights from total clicks and total purchases.
Search Query Insights are super useful for figuring out what customers are searching for on Amazon. They show you how often certain keywords are searched, how many clicks they get, and how well they convert into sales. By digging into this data, you can adjust your listings to improve their ranking and increase your conversion rates. This information also helps you understand your customers better. You can use these insights to fine-tune your ads and SEO strategies, making them more targeted and effective. In short, Search Query Insights can significantly boost your Amazon sales by showing which keywords and trends are performing best. Focus on keywords with high search volume and strong conversion rates to enhance your product listings, improve ad targeting, and gain better visibility in search results. This approach will help you get more clicks, increase engagement, and drive more sales.
In the Amazon Search Query Performance Report, you'll have access to various time-frames to analyze your data. 1. Daily Data: Provides detailed insights for each day, allowing you to track daily performance and identify trends or fluctuations in search queries and sales. 2. Weekly Data: Summarizes data on a weekly basis, helping you observe broader trends and assess the impact of any changes made to your listings or ad campaigns. 3. Monthly Data: Offers a monthly overview, giving you a larger perspective on performance trends over time. This is useful for evaluating long-term strategies and assessing overall effectiveness. 4. Custom Date Ranges: Lets you choose specific start and end dates to tailor the report to your needs. This feature is helpful for analyzing performance during particular periods or campaigns. These time-frames help you understand how your search queries and performance metrics evolve, allowing you to make data-driven decisions and optimize your Amazon strategy effectively.
When analyzing Search Query Insights, several key metrics are crucial: • Search Volume: This metric shows how often a keyword is searched. High search volume indicates strong demand, allowing you to focus on keywords that potential buyers are frequently using. • Click-Through Rate (CTR): CTR measures how often people click on your product listing after searching for a keyword. A high CTR means your listing is compelling and relevant to the search queries, suggesting effective ad copy and imagery. • Conversion Rate: This percentage tells you how many clicks on your listing result in actual sales. A high conversion rate means your product and listing are successfully converting interest into purchases, helping you identify which keywords are driving genuine buyer intent. • Cost-Per-Click (CPC): CPC indicates the cost of each click on your ad. Monitoring CPC helps you manage your advertising budget more effectively by identifying which keywords provide the best return on investment.
It’s advisable to review and update your Search Query Insights data regularly, ideally on a monthly basis. This allows you to stay current with changing search trends and customer behavior. Frequent reviews help you adapt your strategies and maintain optimal performance in both product listings and advertising campaigns.
Yes, Search Query Insights can help identify new product opportunities by revealing search trends and gaps in the market. By analyzing the search queries that drive traffic to your competitors or are frequently searched but not well-served, you can discover potential niches and product ideas that may have high demand but limited competition.
Leave a reply
Latest Blogs

Niche Selection Strategies for Amazon Product Research 2025

How Effective Amazon Product Research Can Help You Thrive on Amazon?

.avif)
.svg)


.png)
.jpg)
.svg)


